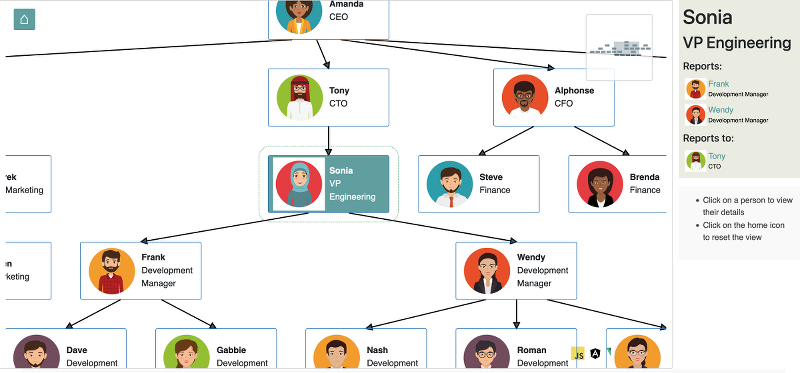
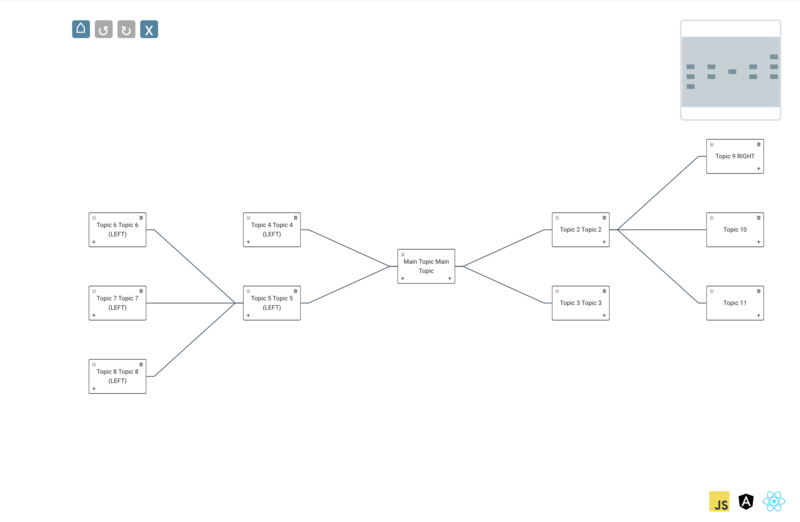
Following on from part 1 of this series, in which we created a visualisation for the progress of each of the group stages, in today's installment we're going to take a look at drawing the post-group stages using the Toolkit's Hierarchical layout.
These stages start with the "round of 16", then go to the quarter finals, then semis, and then the final and the third place playoff. A suitable structure for visualising this is an inverted tree with two root nodes. Here's what we've got:
We use the same dataset that we used in part 1 of this series.
The first step, as in part 1, is to process the groups, although in this post we do not of course then render them (keep an eye out for part 3 of the series, in which we'll bring these two visualisations together to make something super cool).
The next thing we do is to process the knockout round, followed by the quarter final round, then the semis etc, populating each one with results as it becomes possible. This post is being written on the 27th of June, so the group stages are not yet finished, but with this code we should be able to keep our rendering up to date simply by adding the scores of each match.
function processKnockoutMatch(m) {
function getGroup(id) { return worldCupData.groups.find(function(g) { return g.id === id; }); }
function resolveRound16Team(id) { return id != null ? getGroup(id[0]).rank[parseInt(id[1], 10) - 1] : null; }
m.teams = [
getTeam(resolveRound16Team(m.participants[0])),
getTeam(resolveRound16Team(m.participants[1]))
];
m.score = getScore(m);
}
worldCupData.matches.roundof16.forEach(processKnockoutMatch);
Here we obtain the 1st and 2nd ranked teams from the group stages and set them as the teams for the match. This means, of course, that prior to the group stage being finished we are showing teams here which are speculative. But it's kind of cool to see at this point who is likely to make it through to the knockout round.
Quarter finals, semis and the two finals are processed in largely the same way - we extract results from the previous stage. For instance here is the code for the quarter finals:
function processQuarterFinal(q) {
q.teams = [
resolveWinner(worldCupData.matches.roundof16, q.matches[0]),
resolveWinner(worldCupData.matches.roundof16, q.matches[1])
];
q.score = getScore(q);
}
worldCupData.matches.quarters.forEach(processQuarterFinal);
Now we've massaged our dataset we can render it:
toolkit.render({
container:document.getElementById("tree"),
templates:{
"jtk-template-default":"" +
"<div class=\"match-node\">" +
"<div class=\"team\">" +
"<div class=\"flag\">" +
"<img class=\"flag\" src=\"/path/to/flags/4x3/${teams[0].code}.svg\" alt=\"${teams[0].name} Flag\"/>" +
"</div>" +
"<div class=\"name\">${teams[0].name}</div>" +
"<div class=\"score\">${score[0]}</div>" +
"</div>" +
"<div class=\"team\">" +
"<div class=\"flag\">" +
"<img class=\"flag\" src=\"/path/to/flags/4x3/${teams[1].code}.svg\" alt=\"${teams[1].name} Flag\"/>" +
"</div>" +
"<div class=\"name\">${teams[1].name}</div>" +
"<div class=\"score\">${score[1]}</div>" +
"</div>" +
"</div>"
},
layout:{
type:"Hierarchical",
parameters:{
invert:true
}
},
jsPlumb:{
Connector:"Flowchart",
Endpoint:"Blank",
Anchors:["Top", "Bottom"]
},
zoomToFit:true
});
Points to note:
Hierarchical
layout, with invert:true
set. This causes a "top heavy" rendering of the dataset, with roots at the bottom of the view.view
in this case, as we have a single node type, which will be inferred as "default". The toolkit supports a declarative template naming scheme - in this case jtk-template-default
will be resolved as the template for nodes of type default
, which is all of our nodes in this case. The general syntax is jtk-template-<type>
; you can use this arrangement for multiple types within one visualisation.jsPlumb
parameter - specifically, the type of connector and endpoint, and the anchors to use.#tree, #tree2 {
height:500px;
}
.team {
display:flex;
align-items:center;
}
.jtk-node {
border:2px solid #CCC;
padding:7px;
width: 130px;
}
.flag {
margin-right:5px;
}
.flag img {
width:20px;
height:20px;
border-radius: 50%;
border:2px solid #CCC;
}
.score {
margin-left:auto;
}
.jtk-surface-pan {
display:none;
}
In part 3 of this series we're going to take this post and part 1 and MASH THEM UP. Everyone loves a mashup, right? Our mashup is going to provide a view of everything from the group stages down to the finals in one easy to read piece of excellence. Stay tuned!
Ok.
toolkit.render({
container:document.getElementById("tree"),
templates:{
"jtk-template-default":"" +
"<div class=\"match-node\">" +
"<div class=\"team\">" +
"<div class=\"flag\">" +
"<img class=\"flag\" src=\"/assets/flags/4x3/${teams[0].code}.svg\" alt=\"${teams[0].name} Flag\"/>" +
"</div>" +
"<div class=\"name\">${teams[0].name}</div>" +
"<div class=\"score\">${score[0]}</div>" +
"</div>" +
"<div class=\"team\">" +
"<div class=\"flag\">" +
"<img class=\"flag\" src=\"/assets/flags/4x3/${teams[1].code}.svg\" alt=\"${teams[1].name} Flag\"/>" +
"</div>" +
"<div class=\"name\">${teams[1].name}</div>" +
"<div class=\"score\">${score[1]}</div>" +
"</div>" +
"</div>"
},
layout:{
type:"Hierarchical",
parameters:{
invert:true,
orientation:"vertical"
}
},
jsPlumb:{
Connector:"Flowchart",
Endpoint:"Blank",
Anchors:["Top", "Bottom"]
},
zoomToFit:true
});